The Scanlon Foundation Research is proud to publish the Australian Cohesion Index 2023. The Australian Cohesion Index brings together an extraordinary depth of data, knowledge and analysis to provide a robust picture of Australia today.

Welcome to the Australian Cohesion Index.

Drawing on quantitative and qualitative data from multiple sources and tracked every two years, the Index is a comprehensive assessment that provides an ongoing reference to better understand social cohesion in Australia and help plan for the future.

The Australian Cohesion Index 2023 has been structured according to four chapters.

Read more about those involved in preparing the report here.

Introduction
Trends in interpersonal and instutional trust
Trust in democracy and the political system
Political trust among new Australians
Political participation
Trust and participation
Inequalities in trust
Expert commentary by Danielle Wood
Introduction
Declining national pride and belonging
Social, community and economic engagement
Belonging and participation
Belonging and migration
Belonging and acceptance
Prejudice and discrimination
Expert Commentary by Professor Kate Reynolds
Introduction
Economic Growth
Economic inequality and poverty
Education
Financial hardship
Broader impacts of financial hardship
Expert Commentary by Professor Guay Lim
Introduction
Life expectancy
General health
The burden of disease
Mental health and wellbeing
Health and social cohesion
Inequalities in health and wellbeing
Expert Commentary by Dr Kudzai Kunhutu
Introduction
Domain 1: Material conditions – income and wealth
Domain 2: Material conditions – employment
Domain 3: Health
Domain 4: Education
Domain 5: Participation and connections
Domain 6: Political action
Domain 7: Belonging
Domain 8: Worth
Domain 9: Social inclusion and justice
Domain 10: Acceptance and rejection
Qualitative Methodology
Table A1 Interviewees by state
Table A2 Interviewees by country of origin (regional groupings)
Table A3 Length of time in Australia
Background
Acknowledgements
Contact Us

Introduction

Trends in interpersonal and institutional trust

Trust in democracy and the political system

Political trust among new Australians

Political participation

Trust and participation

Inequalities in trust

Expert commentary by Danielle Wood

Introduction

Trust is a key foundation of social cohesion. Trust is a basis for our involvement and engagement in society and our social wellbeing and connectedness. Trust is one of the most important and studied forms of social capital (e.g. Leigh, 2006) and is believed to be an important foundation for social, economic and civic engagement in society and is strongly associated with positive mental health and wellbeing (Nannestad, 2008).

Trust in society is multidimensional. Critical to social cohesion is the trust we have in other people in our communities and in the nation as a whole (interpersonal trust), as well as the trust we have in government, the political system and societal institutions (institutional trust). Interpersonal and institutional trust are separate but related concepts. Our experiences and perceptions of people in government and other institutions shapes how we view and trust people generally in society and vice versa (Kim & Kim, 2021).

Trust in government is important for democracy and the functioning, strength and legitimacy of our political system. Distrust can fuel disengagement and disaffiliation, especially among those who experience social, economic and political marginalisation in other areas. Distrust can also fuel discontent with the political system and the perceived political class, social and political polarisation and demands for fundamental change of either a democratic or anti-democratic character. Blind and unquestioning trust in government, however, is a risk to democracy, making political engagement and activism a critical ingredient in keeping governments accountable and maintaining the strength of our democracy.

In this chapter, we explore trust in Australian society in recent years, views on the strength of our democracy and how these attitudes and perceptions translate to political engagement and action. We conclude with a discussion of the critical inequalities in trust that weigh down our overall levels of social cohesion in Australia and that require community and public attention.

Trends in interpersonal and instutional trust

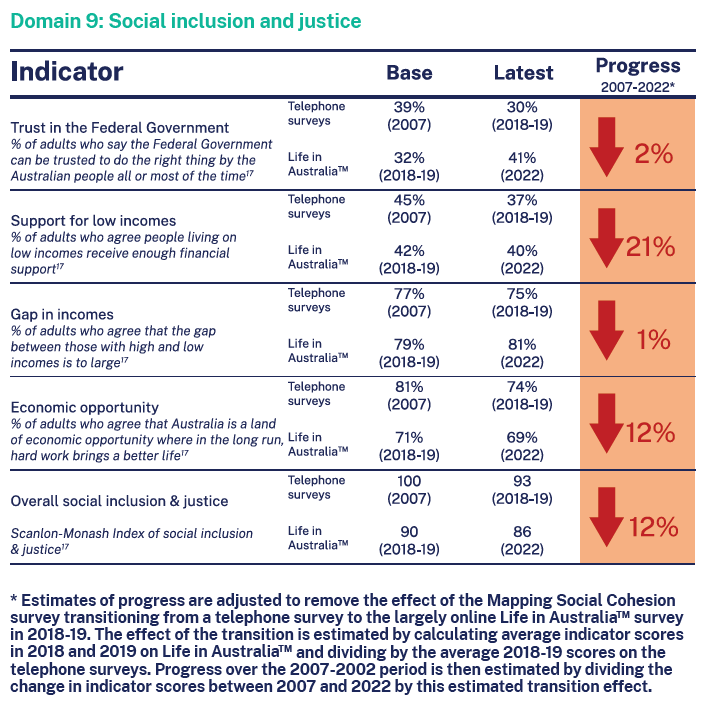
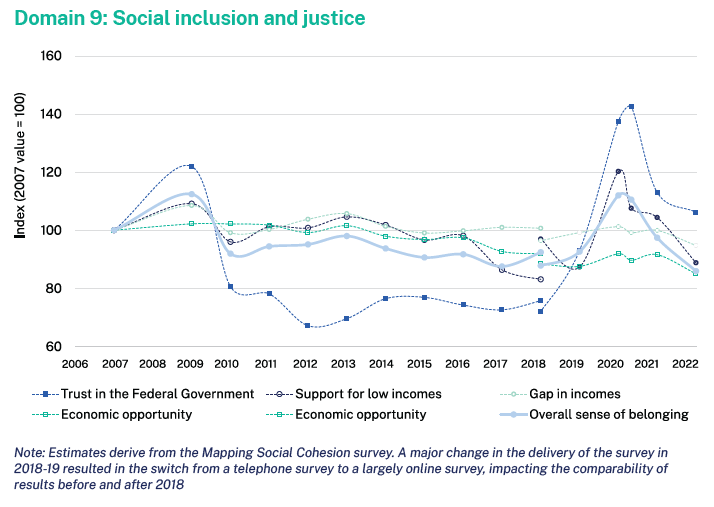
Levels of trust in Australian society have been mixed in recent years. Trust in the Federal Government was relatively low throughout the politically turbulent 2010s. Over the course of this decade, fewer than one-in-three adults believed the Federal Government could be trusted to do the right thing by the Australian people all or most of the time (O’Donnell, 2022). The Scanlon-Monash Index of Social Inclusion and Justice, which includes the measure of trust in the Federal Government, declined from a peak of 112 in 2009 to an average of 93 during the 2010s.

There was though, strong and widespread support for the way in which state and Federal Governments handled the COVID-19 pandemic. In fact, belief that the Federal Government can be trusted to do the right thing all or most of the time increased from 36 per cent in 2019 to 54 per cent in July 2020, not long after the first national lockdown. When asked specifically about COVID-19, approximately two-thirds of people in 2022 said that the Federal Government and their state or territory government had handled the pandemic fairly well or very well, a decline from the very high levels of approval in 2020 but still representing substantial majorities of the population.

Positive response to governments’ handling of the pandemic was reflected in several of our interviews with people who have migrated to Australia over the years. Many of those we spoke with experienced difficult times during the pandemic though most, nevertheless, appreciated government efforts to protect our health and wellbeing:

It felt quite different from [my home country] when COVID happened… The state was the one that was the most affected… And I was quite impressed at how the state can have so much control over each state. Because in [my home country] it’s just one government, and they have to rule the very country and it takes so much to change something… I felt quite good that each state had the decision to make. It was not amazing because we had to go through the hard lock down. But still, I feel like it’s good to have that power (Interview 1.2).

Trust in government and our leaders, however, remains on uncertain ground. Internationally, trust in the Australian national government is similar to, if not somewhat below, the average across developed countries of the OECD and substantially below countries such as Finland and Norway (OECD, 2023a). In 2022, the level of trust in the Federal Government remains above its longer-term average though has declined from its 2020 peak. In 2022, 41 per cent of people said the Federal Government could be trusted to do the right thing by the Australian people all or most of the time. One-quarter of people believe that government leaders in Australia abuse their power all or most the time, while 78 per cent believe this is the case at least some of the time. A degree of cynicism towards government was also reflected in some of our interviews:

Uh, its unpredictable. Election time is good. You hear good news and then everyone is giving [you a] flyer… But after the election, it’s different. And then they try to control the cost of living and then they say it and then the cost of living is up. The bills are up, gas is increased, petrol and electricity and everything is increased… When the group comes to power, the situation emotionally looks okay from the atmosphere, from the media. Then everything disappears… (Interview 1.17).

It just seems to me that they think about lining their own pockets before they actually try to make any changes and move towards something that makes sense. But you know, that’s just my opinion. It just seems they seem to spend a lot of money on campaigning about what they will do, and then not delivering on what they promised and trying to get out of it (Interview 3.4).

Australians are generally more trusting of other people, though we are near evenly split between those of us who are trusting and those who are not. In 2022, 49 per cent of people on the Mapping Social Cohesion survey believed that, generally speaking, most people can be trusted, leaving 50 per cent of us to say you cannot be too careful in dealing with people. Internationally, trust in others in Australia is close to the OECD average but well below the likes of Denmark, Finland and Norway (OECD, 2020). Encouragingly, interpersonal trust increased during the heights of COVID-19. The proportion of adults who agree that most people can be trusted increased from 43 per cent in 2019 to 49 per cent in July 2020 and 52 per cent in 2021 and remained at a reasonably high level in 2022.

In general, I find people to be very friendly. If you ask, people will be willing to give you the help you need… Whenever I needed critical help there’s always help that’s been given to me, and that is because people did not judge me for asking for help, and they took my help as it is, and they offered help, and I’m very thankful for that in the first place, and always will be (Interview 1.20).

Trust in society is an important foundation for engagement in a wide range of social, community and civic activities. Even after accounting for demographic and socioeconomic differences in the population, people who are trusting of others and the Federal Government are more likely to be involved in social or religious groups, including sports clubs, church, hobby, ethnic and adult education groups according to results from the Mapping Social Cohesion survey. People who are trusting of others are also more likely to be involved in community support groups like Rotary groups, the Smith Family, Save the Children, the Australian Red Cross and State Emergency Services.

Trust in democracy and the political system

Trust in the government of the day is, of course, infused with no small amount of partisan politics. Over and above such politics, there are critical questions as to the belief and confidence people have in Australian democracy and the system of government we have.

Results from the long-running Australian Election Study suggest that satisfaction with democracy, while volatile over the last five decades, has been generally declining since 2007 (Cameron & McAllister, 2022). The proportion of people who are satisfied with democracy declined from 86 per cent in 2007 to 59 per cent in 2019, before increasing again to 70 per cent in 2022. Likewise, the proportion of people who believe the government is run for a few big interests rather than all people increased from 38 per cent in 2007 to 56 per cent in 2019 and 54 per cent in 2022. Since 2007, people are also more likely to say that it does not matter who is in power and less likely to say that politicians know what ordinary people think.

Trust in government may also vary between different levels of the political system. While individuals may feel dissatisfaction with political decision-making or policy at the federal level, their views about the operation of the government at the state level or even at the municipal level may be quite different.

The state government and the council, they are amazing. They try their best to do what is best for their people, for the community… The federal government doesn’t give a lot of attention to Tasmania, unfortunately, although it’s a beautiful place. When there is an event we really attract a lot of tourists but there is not enough funds. That is why the council try their best to boost the community, to boost the state with new events, new functions and new festivals, just to lift up the economy and create new jobs (Interview 6.5).

Dissatisfaction leads many to support major and minor changes to our system of government. In the 2022 Mapping Social Cohesion survey, 36 per cent of people said the system of government in Australia requires major changes or needs to be replaced. A further 48 per cent believe minor changes are required, leaving just 14 per cent who believe the system works fine as is. The proportion of people believing that major change is required, declined during COVID-19 but returned to its longer-term average over the last ten years in 2022.

Support for systemic political change in Australia does not translate to support for an antidemocratic or authoritarian state. In the 2022 Mapping Social Cohesion survey, 51 per cent said that having a strong leader who did not have to bother with parliament and elections would be a very bad way of governing Australia, while a further 29 per cent said it would be fairly bad. If anything, the strength of this anti-authoritarian sentiment has strengthened over time and is high, regardless of whether or not people believe that major or minor changes are required to Australia’s system of government. Change therefore, is perhaps best achieved through more democracy than less.

Political trust among new Australians

Migrants to Australia have a diverse range of views about the Australian political system. On the one hand many appreciate the strength of political institutions and the opportunities afforded to them for participation, particularly in comparison to the systems and experiences of their countries of origin. On the Mapping Social Cohesion study, migrants have generally been more likely to trust the Federal Government including both those from English and non-English speaking backgrounds than people born in Australia (O’Donnell, 2022).

Well, you know, from someone who is coming from a post-Communist country in Middle Europe that was locked down for many years, I found Australia very liberal in terms of the services offered, and just the focus on people. (Interview 3.4).

Among those we spoke to, people who have migrated to Australia value everyone’s right to participate; the freedom to speak openly about political matters and to be critical, if necessary; consultative processes that allow input into political decision-making; a functioning opposition that can work as a counterpoint to the government in power; being able to institute a change in government and having a voice.

My overall opinion of Australian democracy is positive since it offers a forum for free speech, participation in society, and the defence of individual rights. But it has advantages and disadvantages, just like every other political system. As an [Asian] immigrant, I value the democratic discourse and participation opportunities provided by Australia (Interview 4.4 – written response).

I love how in Australia, sometimes the opposition or even the people can come up with ideas and propose those ideas and they can be heard. Whereas in other countries you have to be careful. So freedom of speech is something really good – a right that everyone should have. No one should be prosecuted or targeted just because they have their own opinion (Interview 3.11).

However, some interviewees also expressed dissatisfaction about how particular issues of concern to them are being responded to by the government, such as visa policy and discrimination, and concern about broader issues of representation and voice.

Does the government do the right thing by people from different cultural backgrounds? I don’t think it’s necessarily black and white. I think in certain instances they [the government] have done the right thing by people. And I think in certain instances they’ve done the wrong thing by people. And for the most part, I think, where they’ve done the wrong thing by people from different cultures and communities is around election time when they are looking for the votes from the majority. And then, I think once they establish some level of power they cool off on some of those statements. But a lot of the time, by then, the damage has already been done (Interview 4.2).

Political participation

Participation in politics and the democratic system is an important behavioural manifestation of institutional trust. Participation can take a number of forms, including voting, signing petitions, joining protests and boycotts and communicating with Members of Parliament.

But people here are a lot more engaged in the politics as well, which is a great thing. I think everyone seems to have certain opinions of the government, good or bad. They feel a lot more educated – they educate themselves by actively watching the news, reading articles, being more conscious about discrimination or the First Nations issue… People do have a voice here, even people within my generation, the younger generation. And obviously the government is very aware of that (Interview 1.5).

Voting is, of course, one of the foundational acts of political engagement. Voting rates are very high in Australia by international comparison with voting compulsory for eligible populations. There is a reasonable degree of variation though in voting practices in Australia that speak to levels of engagement in democracy and the political process.

Here, either you like it or not but you’ll vote or be fined. Which I guess is a really good thing if we look at it. For the government to enforce it, [to make] you exercise your rights as a citizen to be able to choose your government, then if they’re not performing well you can hold them to account. I think it’s a really good thing. The ability for the people to either put you there or remove you, it just stops them from getting too much over their heads. It lets them know there’s a limit to how far they can go and reminds them that they are actually representing the people that put them there (Interview 1.7).

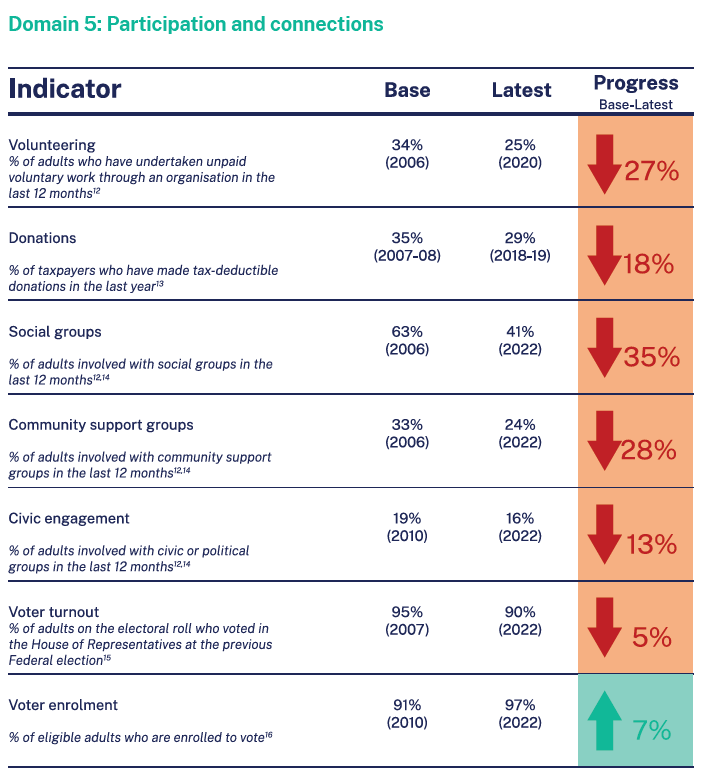
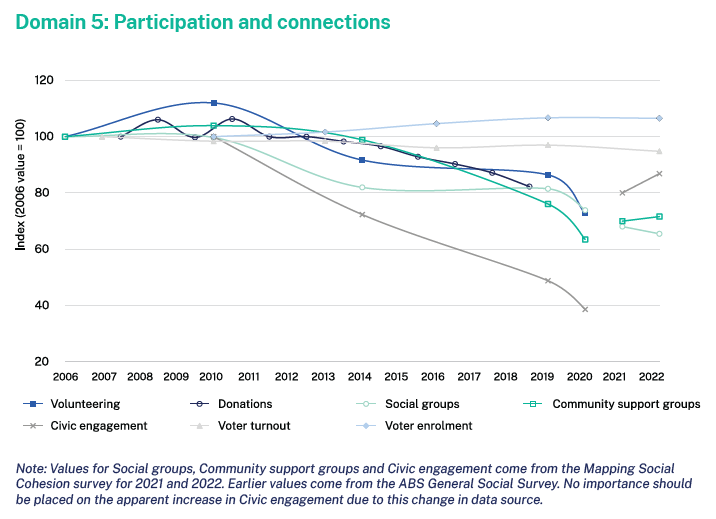
The Australian Cohesion Index measures the extent of voter turnout in the social and community participation domain with data derived from the Australian Electoral Commission (AEC, 2022). Voter turnout – or the number of votes cast as a proportion of the number of people enrolled to vote – was 90 per cent in 2022 for both the House of Representatives and the Senate. This turnout was five points lower than what it was in 2007 and the lowest level in several decades. While this might be a cause for concern, the low turnout in 2022 was likely the result of very high voter enrolment. The number of eligible people who were not enrolled to vote declined from 1.4 million people in 2010 to 564,000 in 2022 (AEC, 2023a). Overall, approximately 88 per cent of the eligible population voted in the 2022 Federal election, similar to levels since 2013 and higher than the 2010 election (85 per cent). Informal voting, for its part, has remained in line with its 2007-2022 average (AEC, 2023b).

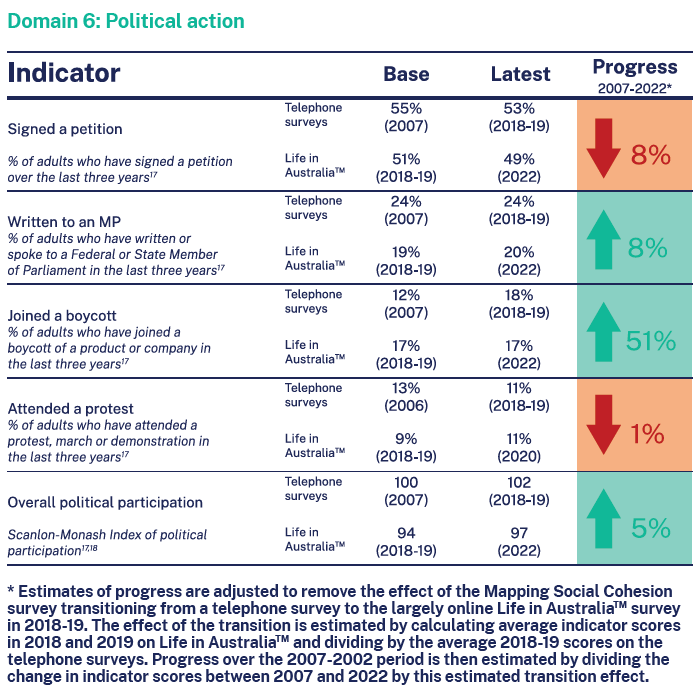
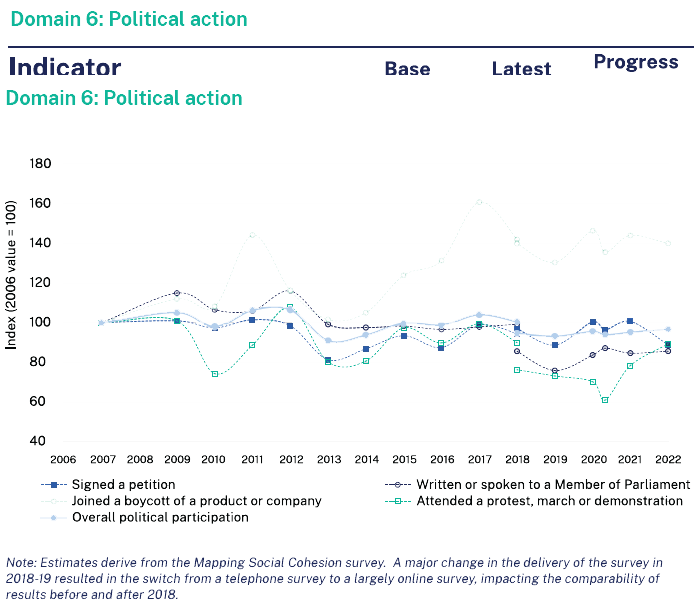
Political participation has otherwise been reasonably stable in recent years with modest fluctuations. In the Mapping Social Cohesion study, the index of political participation has moved within a relatively narrow band between 90 and 110 between 2007 and 2022. In the more recent period between 2018 and 2022, 50-60 per cent of people say they have signed a petition in the previous three years, one-in-five people consistently report having written or spoken to a member of parliament, one-in-six people have joined a boycott, one-in-ten people report attending a protest, march or demonstration and one-quarter posted or shared political information or views online.

Political participation has changed in composition in recent decades with the rise in digital technologies. According to the Australia Election Study, the proportion of people who had contacted officials in person or in writing in the previous five years declined from 27 per cent in 2001 to 16 per cent in 2022, while the proportion who had contacted officials by email increased from 13 per cent in 2010 to 23 per cent in 2022 (Cameron & McAllister, 2022). The proportion who had signed a written petition declined from 72 cent in 1987 to 32 per cent in 2022, while the proportion who had signed an online petition increased from 12 per cent in 2004 to 48 per cent in 2022.

Trust and participation

Political participation has an interesting and complex relationship with institutional trust. On the one hand, political protests and other forms of political activism arise from disenchantment with current policies and systems. By the same token, activism signifies a willingness to engage and fight for change, and perhaps also a belief that our leaders will respond and change can be achieved.

The Mapping Social Cohesion survey generally suggests that people are more politically active if they distrust government and the political system. However, the complexity of the relationship is reflected in the diversity of responses. In 2022, 72 per cent of people who almost never trust the Federal Government and 69 per cent who think Australia’s political system needs major change said they had signed a petition, communicated with a Member of Parliament, joined a boycott or protest or posted about politics online in the last three years. While these proportions are significantly higher than for people who are more trusting, the majority of people who trust the government most of the time (57 per cent) or believe the political system needs only minor change (59 per cent) had also been politically active in these ways. Political engagement therefore is an important means of effecting political change for people with both high and low confidence in the current system.

Political participation is no doubt associated with political knowledge. Full and meaningful participation relies on having an understanding of the system you are engaging with and knowledge of potential avenues of participation. For migrants to Australia, the Australian political system is complex, with three independent (yet sometimes interconnected) tiers of government. Processes are in place for proving political information and education, particularly around the time of citizenship, but it is limited. The agency of individuals or cultural community groups sometimes helps to fill this void.

We know the problems; we understand the needs. But our community sometimes doesn’t understand how the system works. That’s where we are in the middle. We are in between, you know, the systems here ourselves with the services and stuff and then with our communities (Interview 3.10).

The system of government is hard to understand. The men understand it, it is not easy for women (Interview 1.8).

Inequalities in trust

Differences in trust across society mirror socioeconomic inequalities. As noted in the Mapping Social Cohesion 2022 report, people with lower levels of education, those living in disadvantaged neighbourhoods and those who describe themselves as poor or struggling to pay their bills are much less likely to believe that people can be trusted. In 2022, just 28 per cent of people who were struggling to pay bills or poor were trusting of other people, compared with 68 per cent for people who describe themselves as prosperous or very comfortable and 53 per cent for those who are reasonably comfortable. Only one-in-five people (20 per cent) who said they were struggling to pay bills or poor in 2022 believed the Federal Government could be trusted all or most of the time. The way in which financial pressures breed cynicism and distrust in the political system was reflected in some of our interviews:

People can’t even afford basic necessities like electricity – it’s just gone through the roof, you know? So trust in the government I think is not there at the moment… I feel like for the first time ever they’ve just lied and lied and lied. I never used to think that about the Australian government before. Yeah, politics is a bit of lying, but it’s just been so full on in the last two to three years that people don’t trust them anymore (Interview 3.1).

Young adults also, report lower levels of trust. In 2022, 42 per cent of 18-24 year-olds and 46 per cent of 25-34 year-olds believe that people can be generally trusted, compared with 54 per cent of those aged 65 years and over. Just 36 per cent of 18-24 year-olds and 32 per cent of 25-34 year-olds believed the Federal Government can be trusted to do the right thing all or most of the time, compared with 48 per cent of people aged 65 years and over.

Demographic and socioeconomic gaps in interpersonal trust appear to have widened in recent years. Between 2018 and 2022, a reasonably steady 28-30 per cent of those struggling to pay bills were trusting of others. Levels of interpersonal trust increased substantially, by contrast, for people who describe themselves as prosperous or very comfortable (54 per cent in 2018 and 68 per cent in 2022) or reasonably comfortable (45 per cent in 2018 to 53 per cent in 2022). Similar patterns were recorded across age groups, where levels of interpersonal increased for people aged 35 years and over between 2018 and 2022 but remained stable for those aged 18-34 years. The tends to suggest that the galvanising effect of our public and community response to COVID-19 was not felt by all, leaving some groups, particularly young adults and those who continue to struggle financially, feeling marginalised.

Differences in trust across age and socioeconomic groups are common around the world. Young adults aged 18-29 years were less likely to trust other people than those aged 50 years and over in all 14 developed countries surveyed in the Pew Research Centre’s 2020 Global Attitudes Survey, with significant differences recorded in nine of those 14 countries (Connaughton, 2020). Among these countries stretching across western Europe, north America, east Asia and Australia, Australia recorded the second largest gap in trust between young and older people. More encouragingly though, the gaps in trust in Australia between high and low income and education groups were smaller than most other surveyed countries.

Inequalities in trust across society illustrate the multidimensional pressures on social cohesion in Australia. As explained in this chapter, trust in people and government is far from a universal trait across the country, nor in the world. Approximately as many people are distrusting of others as are trusting, while a minority of people consistently trust the Federal Government. Perceptions of our democratic system nevertheless remain strong and most calls for change are likely in the direction of strengthening rather than weakening democracy. Our sense of trust was also strengthened during the COVID-19 pandemic, giving governments an important tool to protect our health and material wellbeing. We can hope to learn from the pandemic and restore that trust. A key first step is to identify and address inequalities in trust across demographic and socioeconomic groups.

Expert Commentary by Danielle Wood

Written by Danielle Wood
Chief Executive Officer, Grattan Institute

‘Ultimately, trust is the political capital that our leaders draw on to make hard policy decisions. And building this capital is crucial for supporting the necessary actions on big, but slow-moving, challenges such as climate change and population ageing.’

The Scanlon Foundation Research Institute’s Mapping Social Cohesion results give cause for some cautious optimism about the trust Australians place in politicians and each other.

After more than a decade of downward slide, trust in federal government turned around during the pandemic, when Australians got behind political leaders and the COVID-19 response. And while the very high levels of trust during the ‘crisis phase’ were never likely to last, it is at least promising that in 2022 trust levels were still above the long-run average.

But history tells us that this trust is fragile and must be nurtured by political leaders. That means politicians who promise integrity and transparency must deliver on those promises. And governments should avoid setting unrealistic expectations about what they can achieve. Ultimately, trust is the political capital that our leaders draw on to make hard policy decisions. And building this capital is crucial for supporting the necessary actions on big, but slow-moving, challenges such as climate change and population ageing.

Similarly, the trust Australians have in other people, while down from 2020 highs, remains above where it was pre-COVID.

Even after taking account of socio-economic and demographic differences, those with higher trust in government and in other people were more likely to participate in community activities such as social, religious, and sporting groups, or volunteer organisations. That’s a powerful finding. It reinforces the importance of community engagement to people’s wellbeing.

On the other hand, the much lower levels of interpersonal trust among those with lower levels of education, or who live in disadvantaged neighbourhoods or consider themselves poor, reminds us of the broader social impacts of failing to address poverty in our communities.

One positive political development in 2023 has been the recognition of the importance of trust and civic engagement in building social cohesion. The Federal Government’s Measuring What Matters statement includes measures of trust in government, public services, and other people, as well as social connection, in its measures of social cohesion.

The focus on these indicators – as part of a suite of 50 measures to track the wellbeing of Australians – will hopefully generate increasing interest in these issues from politicians and the community.

Introduction

Declining national pride and belonging

Social, community and economic engagement

Belonging and participation

Belonging and migration

Belonging and acceptance

Prejudice and discrimination

Expert Commentary by Professor Kate Reynolds

Introduction

Belonging is the sense to which we feel connected to other people, places and collective experiences. To belong is to have a place in the world, to feel a part of the communities and societies around us and is critical to our identity and self-perception. To feel we belong is often regarded as a fundamental human need, rooted in our biology as social beings (Allen et al., 2021). In times of stress and adversity, humans are thought to seek out social and emotional connections in the interests of our own survival and wellbeing (Taylor, 2012). Belonging and identity are therefore important for our mental health and wellbeing (Cruwys et al., 2023; Steffens et al., 2021) and is a central component of our national social cohesion (Chan et al., 2006).

Participation and involvement in community activities and groups is a powerful way in which the sense of belonging translates into positive actions that deliver public benefits. The relationship between belonging and participation is likely mutually re-enforcing. A sense of social identity and belonging is a key foundation for people to want to be involved in community groups and activities (Turner & Reynolds, 2012), while that involvement can foster social connections and bonds that re-affirm community identity and the sense of belonging.

Belonging, identity and participation operate at multiple levels. We can simultaneously identify and actively engage with our families, friendship networks, local communities, ethnic, cultural, religious and sports groups and our countries of birth and residence. Managing and navigating multiple social identities can create complexity and personal conflict (Roccas & Brewer, 2002), especially in diverse and multicultural societies such as Australia’s. Prejudice and discrimination can arise where we perceive negative characteristics of other groups in relation to our own (Reynolds & Turner, 2006).

Declining national pride and belonging

Australians have traditionally felt a strong sense of national pride and belonging by international comparison. On the World Values Survey, approximately seven-in-ten Australians (71 per cent) said they were very proud of their nationality over four survey waves between 1981 and 2012 (Inglehart et al., 2021). This was one of the highest levels among all developed countries in the world that were surveyed in either the World Values Survey or the European Values Survey during this period. However, this proportion dropped to 57 per cent in 2018, still high by comparison with other developed countries, but a substantial and significant decline.

The sense of national pride and belonging in Australia has also been declining on the Mapping Social Cohesion survey. In 2022, one in two adults (52 per cent) said they have a great sense of belonging in Australia. We estimate that this proportion has fallen by 20 percentage points since 2007. Likewise, the proportion of adults who take great pride in the Australian way of life and culture has declined by an estimated 11 percentage points since 2007 to 37 per cent in 2022, while the proportion who agree that maintaining the Australian way of life and culture is important has declined by an estimated 14 percentage points over the same period to 42 per cent in 2022.

The decline in national pride and belonging have been felt across Australian society. As reported in the 2022 Mapping Social Cohesion report, declines have been recorded for young and older adults, overseas and Australian born populations and those from higher and lower socioeconomic backgrounds. Declines though have been largest for young adults and this has exacerbated pre-existing differences between generations. In 2022, just 34 per cent of 18-24 year-olds and 31 per cent of 25-34 year-olds said they have a great sense of belonging in Australia, compared with 75 per cent of those aged 65 and over. While this proportion declined across all age groups between 2007 and 2022, the recorded decline was more than four times larger for younger adults.

We know there are lots of factors that affect national pride and belonging particularly for young people. Major social, cultural and technological changes shift and shape how emerging generations relate to their country and the world. The extent to which governments and the country as a whole are responding to the challenges that are important to young people are likewise important. These can affect young people’s attachment to their country without necessarily impacting their wider social connections and overall wellbeing.

However, we also know that young adults feel a sense of disconnection and lack of belonging in other areas. For instance, young adults are less likely to feel a sense of belonging in their neighbourhood and more likely to feel isolated from others. On the 2022 Mapping Social Cohesion survey, two-thirds (67 per cent) of 18-24 year-olds and 59 per cent of 25-34 year-olds feel isolated from others often or some of the time, compared with 30 per cent of people aged 65 and over.

I know several persons, but I don’t have a close friend because of my culture, my personality… it is completely different from other young people here. So it is hard to find a friend (Interview 6.4).

The connections and belonging that people have within their neighbourhoods remain strong. More than eight-in-ten (82 per cent) people agreed that they feel they belong in their neighbourhood and two-in-three (66 per cent) believe their neighbourhood has a strong sense of  community on the 2022 Mapping Social Cohesion survey. The proportion of people who agree that their neighbours are willing to help each other increased from 81 per cent in 2018 to 85 per cent in 2022, while the proportion who believe that their neighbours from different national and ethnic backgrounds get on well together increased from 76 per cent to 83 per cent over the same period.

Well, I have lived in the same house ever since I moved to Perth about five, six years ago. And I have had really good experiences living in this house in my neighbourhood. I have got like okay relationships with a couple of my neighbours who are also migrants from other parts of the world… I find my neighbourhood really good. It’s close to the shopping centre, close to a beautiful lake. I love, yeah, living in the house that I live in. That’s what my local community is like (Interview 5.4).

Social, community and economic engagement

There is some evidence to suggest rates of social, community and civic engagement have also been declining. All indicators on the social and community participation domain of the Australian Cohesion Index recorded declines between 2006 and 2022. According to the ABS (2021) General Social Survey, the proportion of adults who had been involved in social groups declined from 63 per cent in 2006 and 2010 to 46 per cent in 2020. This proportion was 41 per cent in 2022 in response to a similar question on the Mapping Social Cohesion survey (O’Donnell, 2022). Likewise, the proportion of adults involved in community support groups declined from 35 per cent in 2010 to 21 per cent in 2020 (on the General Social Survey) and 24 per cent in 2022 (on the Mapping Social Cohesion survey). Involvement in civic and political groups declined from 19 per cent in 2010 to 7 per cent in 2020 on the General Social Survey, though was reported at a higher level on the Mapping Social Cohesion survey in 2022 (16 per cent).

Economic participation and engagement, by contrast, have been high and increasing in recent years. All indicators on the employment domain of the Australian Cohesion Index recorded positive progress between 2008 and 2022 (see the chapter ‘The Australian Cohesion Index’). The proportion of people employed or looking for work – the labour force participation rate – increased from 76.6 per cent in June 2008 to a then record high of 80.5 per cent in June 2022 among people aged 15-64 years (ABS, 2023b). Unemployment rates among the total adult population and among young people (15-24 years) have declined to low levels since COVID-19, along with the underemployment rate – all of which indicate that people are willing and increasingly able to engage in employment.

Indicators of participation in education and training have also recorded progress. The proportion of adults aged 20-64 years who hold a Certificate Level III qualification or above increased from 59 per cent in 2008 to 69 per cent in 2021, while the proportion with a university degree increased from 24 per cent to 36 per cent. The proportion of young adults (15-24 years) who are fully engaged in employment or study declined somewhat from its peak of 84 per cent in 2008 to 82 per cent in 2022 but has been increasing since COVID-19 and was higher in 2022 than it has been since 2008.

Belonging and participation

Belonging and participation are closely related. A sense of identity and belonging to one or more groups is an important theorised condition for involvement in group activities (Turner & Reynolds, 2012). On the Mapping Social Cohesion survey, people who have a strong sense of belonging in their neighbourhoods and Australia are substantially more likely to be actively engaged in their communities. Among people who have a great sense of belonging in Australia, 45 per cent have been involved in social groups, 26 per cent have been involved with community support groups and 26 per cent have been involved with civic or political groups in the last 12 months. These estimates are up to 2.3 times higher than for people who have no sense of belonging in Australia (20 per cent, 14 per cent and 15 per cent respectively). These differences are significant and substantial even after accounting for people’s demographic and socioeconomic characteristics and migrant status.

Generally, we are a good, connected community. We are concerned about what’s happening back home most of the time. And we are involved in life in Australia. I have been a nurse for 13 years. How many patients have I helped? How many patients have I supported or worked with? I did a lot of good things and [I have] contributed to Australian life in a positive way. Every day I work. I go on time, punctual and happy with people. Also, within my community, I work on the community committee management. I have completely given myself because of the people back home who have a hard life (Interview 1.16).

I’m retired but very busy with two Chinese traditional music groups. Members in one group are mainly retired persons; another one is more professional. Every Tuesday and Saturday I have rehearsal sessions…

I am a member of the community board. We [the music group] are invited to perform at aged care facilities to entertain the elderly. I am also elderly and hope to have other people entertain me in the future. Other than these, my sense of belonging also includes my participation in a local [Western] entertainment [music] group. I also join my community’s morning walk every week… I’m also a representative for a Buddhist temple and I translate for visitors (Interview 1.10).

Belonging and migration

We expect some groups will have a lower sense of belonging and engagement in Australia. Our newest Australians who have migrated here, especially, require time to establish their social connections and roots in Australia and their local communities. Others who have arrived in Australia in recent years, including students and temporary workers, may only be in Australia for a short time and intend returning to their home country. In 2022, just 22 per cent of people who have lived in Australia for less than 10 years said they have a great sense of national belonging, compared with 58 per cent of people born in Australia. Approximately, 40 per cent of people who have migrated to Australia in the last 10 years from non-English speaking backgrounds have been involved with social, community or civic groups in the last 12 months, compared with 56 per cent of the Australian-born population.

Maybe my life in the last four years is very hard because of the challenging language, the challenging culture. No friends… no close friends… Some people are maintaining distance. So for a long time [it was] very hard, but now it is better… (Interview 1.8).

So the groups and community groups that I was always involved with sort of always helped… like I was part of this group. We used to go to the mosque. We used to spend our school holidays there and that gave me a good sort of foundation. I always try to stay connected to the community, to do something community-minded, because that’s you know what my faith teaches me to do. I find Islam is a very social religion; everything’s done in groups. So that’s one of the great things that I love about my faith… I always found that wherever I went… there was a Muslim community there. Other Muslims will try to be around and that always made me feel connected to those places (Interview 2.7).

People who have been living in Australia for longer periods of time have higher levels of belonging and engagement. There is little difference, for example, in levels of social, community and civic participation between those who were born in Australia or have been living in Australia for ten years or more (O’Donnell, 2022). This likely speaks, at least in part, to positive processes of integration and acculturation where people come to feel and experience stronger connections and identity in Australia over time. These processes though are not guaranteed, and many factors support and impede social integration.

I guess because I’ve lived here for so long now, I try to involve myself in a lot of things. I’m one of the regional representative council members for [a] Commission. So that gives me an opportunity to mix with people and in my local community here. There was a time I ran for council, and the reason I did that was just to put a face of difference to my community so they understand that Australia – actually that was my slogan – Australia belongs to all… So I make myself relevant. That’s how I can say it. I guess I have the opportunity to do that because I work within the community in a positive way so people can see me in a positive light (Interview 1.7).

Belonging and acceptance

Helping in the social and community integration of new Australians is an important responsibility for everyone in society. Theory and research show that the successful integration of migrants in society is a two-way street (Berry et al., 2005). Migrants often go to great lengths to learn English, learn about Australian culture and customs, navigate multiple personal, national and cultural identities, make friends and develop social networks and equip themselves with the skills to succeed in the economy and society. Society-at-large must facilitate these processes through psychological and practical support, opportunities and a generally welcoming community with structures and support systems that help people to maintain their cultural identities while growing into their new Australian
identities. This is a critical part of the integration process for many.

The value and benefits Australians see in multiculturalism and ethnic diversity is an important resource in supporting migrant integration. On a very large number of indicators in the Mapping Social Cohesion survey, Australians increasingly value the social, cultural and economic benefits that migrants bring (O’Donnell, 2022). In 2022, 88 per cent of people believe that multiculturalism has been good for Australia and 78 per cent agree that accepting immigrants from many different countries makes Australia stronger – proportions that have increased significantly just in the last five years.

Positive and accepting attitudes towards our newest Australians can support migrant integration, particularly where positive attitudes translate to active intercultural relations. Friendships across ethnic and cultural divides is a particularly powerful form of relations, and opportunities for friendships across groups is thought to be an important condition for harmonious relations (Pettigrew et al., 2011). In 2022, eight-in-ten Australian adults said they have at least two close friends from different national, ethnic or religious backgrounds from their own, a figure that rises to almost nine-in-ten for overseas born Australians (O’Donnell, 2022). People with friends from different backgrounds are also more accepting of people from different backgrounds and are more likely to be involved with social, community and civic groups.

Yeah, it hasn’t been about meeting people from my ethnic background —South Africa. It has actually been about building a connection of people who will be relevant to me. So a couple of times I met some South Africans here in Australia, but it’s not all about South Africa. It’s about meeting other people, you know, and looking for ways to build a beneficial relationship…

But it’s easier to connect with someone of my ethnic background. You know we exchange, we speak, the bonding process goes a lot faster, so it becomes a lot easier when it comes to meeting someone from the same rather than a different ethnicity. It takes a whole lot of conscious and careful effort to build [another] relationship (Interview 2.3).

My community is a culturally diverse one, with neighbours from Western, Australian- Korean, Australian-Vietnamese, and Australian-Chinese backgrounds. I have a harmonious and enjoyable relationship with my elderly Vietnamese neighbour, who doesn’t speak English, but we communicate well through body language and gestures. (Interview 1.13, written response).

Prejudice and discrimination

But even at Church <laugh>, it’s the same. There is no sense of belonging. It’s the same. People don’t give you, uh, the privilege to talk. When you say something, you know, it’s like totally different. Like they think they don’t experience what you experience. They think you are stupid (Interview 2.1).

Despite friendships and positive attitudes to migrants and multiculturalism in Australia, prejudice and discrimination are potential barriers to the social integration and belonging of new Australians. In 2022, one-in-three adults from non-English speaking backgrounds reported experiencing discrimination on the basis of their skin colour, ethnic origin or religion in the previous 12 months (O’Donnell, 2022). Among people from non-English speaking backgrounds, discrimination was most commonly reported by young adults and those who have recently arrived in Australia.

I know some Australians [White kids] from my high school but I don’t think they are my ‘friends.’ They did not really want to be friends with me but to mock me, for instance, for my accent and my culture. I have no contact with any of them now (Interviewee 1.12).

Discrimination is likely detrimental to the development of community and national identity, belonging and engagement. The experience of discrimination can reinforce a person’s perception and status as an ‘outsider’ and be detrimental to their mental health and wellbeing (Reynolds & Klik, 2016). In the 2022 Mapping Social Cohesion report, people who have experienced recent discrimination were found to have a weaker sense of belonging, worth and social inclusion (O’Donnell, 2022). While it is difficult to determine how much discrimination causes these feelings, we can say that the relationship between discrimination and these domains of social cohesion cannot be explained by other characteristics like age, education and migrant, language and socioeconomic background.

I feel like I don’t fit in this society since I have encountered so much visible and invisible discrimination here in Australia (Interview 4.4, written response).

The experience of discrimination is mirrored in prejudicial attitudes to migrant and religious groups. While the vast majority of adults have a somewhat or very positive view of European immigrants from Italy (93 per cent), Germany (92 per cent) and the United Kingdom (92 per cent), people are much less likely to have a positive view of people arriving in Australia from non-European backgrounds, including India (70 per cent), China (60 per cent), Iraq (59 per cent) and Sudan (53 per cent) (O’Donnell, 2022). Only around one-infour people have a positive view of Muslims, while 29 per cent have a negative view. For some Australians, the COVID pandemic exacerbated or perhaps brought some of these prejudicial attitudes to the fore.

During COVID I was walking down the street, and then someone yelled at me from the car. They were driving past me, saying like, ‘Go home’. Why did they say like ‘f# Chinese go home’ or something? Because that’s when COVD was starting. So I did have someone yell at me (Interview 1.5).

Theory and research suggests that prejudice is complex. Our prejudice is wrapped up in our own social identities and the factors that distinguish the groups that we belong to – as much, if not far more, than any ingrained beliefs or fixed personality traits (Reynolds & Klik, 2016). The positive news then is that we can hope to address and reduce prejudice, including by fostering inclusive national and local identities that value and celebrate differences and diversity, counter public messaging that seek to reinforce prejudice and create opportunities for connections and friendships across groups.

Encouragingly, prejudicial attitudes appear to have become less common in recent years. The proportion of adults who express a positive view of people born in China increased from 52 per cent in 2020 to 61 per cent in 2022, while the proportion with negative attitudes to Muslims declined from 40 per cent to 29 per cent (O’Donnell, 2022). Encouragingly, declines in negative attitudes have been particularly prominent among groups that have been traditionally more likely to hold negative attitudes, including older people, conservative voters and people living in non-metropolitan areas. These patterns mirror trends in support for multiculturalism and immigrant diversity in Australia, suggesting that attitudes have been shifting across society. This bodes well for the future of multiculturalism in Australia – notwithstanding the critical unfinished challenge in further tackling prejudice and discrimination.

Addressing prejudice and discrimination sits within the broader challenge of strengthening Australian identity and belonging in such a socially, politically and culturally diverse society. As reported in this chapter, the sense of belonging and community engagement appear to be declining in Australia. While we expect the strength of national pride and belonging to ebb and flow with social, cultural and generational change, we must nevertheless ensure that all Australians have the opportunity to develop a sense of place and community however they define it. This is important for who we are as humans, for our personal wellbeing and for the vitality and connectedness of our communities and society.

Expert Commentary by Professor Kate Reynolds

founding Director and Steering Committee member of the Australian National University Grand Challenge ‘Australian Social Cohesion: Exploring New Directors’ 2019 – 2023.
(expert for the Australian National University Grand Challenge Project ‘Social cohesion, diversity and inclusion’ 2019-2023)

‘One silver lining of COVID-19 is that it showed us how to strengthen social cohesion in Australia.’

Having a sense of belonging is fundamental to being human. It drives other social and wellbeing outcomes for individuals and communities. Outcomes around worth, participation and health all flow from belonging. Future prosperity is tied to social cohesion today. It therefore sets off alarm bells to see all four key indicators around belonging in this report showing a downward trajectory over the last 15 years. It raises the question, ‘What are the critical thresholds – the tipping points – where it becomes much harder to recover the lost ground?’ If we don’t act now to strengthen social cohesion, will it be too late to reverse the trend?

We don’t compare well to other ‘like’ nations. For example, it is very concerning that Australians’ trust in our national government is slightly below the average of other developed countries in the OECD.

In my view, our political and community leaders aren’t fulfilling their role to help people make sense of their circumstances, grow consensus and build confidence in plans for the future among current and next generations. How do we have national belonging and pride if we are living in an information vacuum where we don’t know what we are succeeding at as a nation and the challenges are masked? Instilling this awareness builds a sense of shared endeavours and helps shape a resilient democracy.

Leaders also shape the norms, values and beliefs of the group (and the nation) and reinforce what it means to be a good group member. Through their meaning-making and role modelling, leaders can escalate or minimise societal issues such as discrimination.

Looking at the patterns over time in this report provides some answers. One silver lining of COVID-19 is that it showed us how to strengthen social cohesion in Australia. The pandemic turned our country into a real-world laboratory for achieving rapid change in the face of a sudden crisis. The lessons learned give us important clues about how we can minimise further decline in social wellbeing and potentially achieve uplift in key areas that influence Australia’s social and political fabric.

The federal government’s COVID safety-net payments, for example, meant people felt cared for, valued and supported; inequality was being addressed. We also saw strong leadership on show, as political leaders and senior public servants stepped up to explain to the public what was happening and how they were responding to the pandemic. They continually, proactively, communicated with the community without trying to sell to them or grab headlines. National Cabinet provided rare moments of political and government coordination and cooperation. This boosted people’s trust in government; we now know what measures work to build trust and belonging. But that novel experience ended once the crisis had passed.

Appointing a Minister for Social Cohesion, and distilling the essence of what we learned during the pandemic to stem the decline in these critical social wellbeing indicators, would be a powerful investment in Australia’s future prosperity. There are also a quarter of a million government employees who could be empowered and given the time and to treat their role as supporting a resilient democracy. These public servants are the interface between government and the community, and every interaction speaks to the capability and care of government, influencing levels of trust and how people feel about their place in society.

What makes an explicit, strategic response even more urgent is that the recorded decline in belonging in Australia was significantly greater for younger adults, and this sentiment translates down to the neighbourhood level. An obvious place to address this is in our schools. This is already happening through the national community hubs network; however, schools could play an even bigger role in deepening participation and connection at the local level.

Deliberate, strategic effort is needed to turn these trajectories around before it is too late. There are limited windows in time to respond in a coordinated way to address such socially corrosive issues. The data in this report indicates that we are currently in one of those
pivotal points in time.

Introduction

Economic Growth

Economic inequality and poverty

Education

Financial hardship

Broader impacts of financial hardship

Expert Commentary by Professor Guay Lim

Introduction

Economic and cost of living pressures has one been of the hot button issues of the last two years. Rising inflation, increasing interest rates and slow growing incomes place pressure on household finances and bring the economy to the front of people’s minds and their concerns. As reported in Mapping Social Cohesion 2022, the economy has returned to being the number one issue facing Australia for the largest proportion of people since the end of the COVID-19 pandemic. At a household level, the experience of financial stress and dissatisfaction has become more common and translated into fears for the world economy. In 2022, three-quarters of people were either very or quite concerned about the prospect of a severe downturn in the global economy (O’Donnell, 2022).

The economy and the ability to provide for the material wellbeing of a wide cross-section of Australians is a critical foundation for our collective wellbeing and social cohesion. As the Mapping Social Cohesion study has shown, financial wellbeing is very strongly related to social cohesion (O’Donnell, 2022). Much of the wider academic research in this area also asserts that household and neighbourhood disadvantage is strongly related to indicators of social cohesion (e.g. Twigg et al., 2010). In this way, economic inequalities weigh down our overall social cohesion and contribute to social inequalities and the potential for division.

In this chapter, we explain some of the key economic trends in Australia in recent years, including in terms of incomes, employment, inequality and financial hardship. The discussion relates particularly to the worth, social inclusion and justice, income and wealth domains of the Australian Cohesion Index. We draw on what recent data are available to describe the financial and cost-of-living pressures facing Australians today, but also the strength of the labour market. We explain how financial pressures weigh down our overall social cohesion by contributing to a weaker sense of trust, belonging, social inclusion and acceptance in society, as well weaker personal happiness and wellbeing.

Economic Growth

The Australian economy has experienced steady and resilient growth in recent years and decades. The Australian economy grew every year for 28 years between 1991 and 2019, with Gross Domestic Product (GDP) more than doubling over that time, from $858 billion in 1991 to $1,548 billion in 2008 and $2,036 billion in 2020 after adjusting for inflation*. After a contraction during the pandemic, the economy has continued growing, reaching $2,155 billion or almost $84,000 per person in 2022 (ABS, 2022a).

Economic growth per person – an important indicator of our material standard of living – however, has been modest in recent years. After averaging growth of 2.1 per cent per year in the ten years to June 2000 and 1.6 per cent in the decade to June 2010, growth in GDP per person averaged just 0.8 per cent per year in the 2010s. After a contraction in 2020, GDP per person bounced back, with growth of 1.8 per cent in 2021 and 3.1 per cent in 2022. Median disposable household income likewise grew by an average of 0.7 per cent per year between 2007-08 and 2019-20 after adjusting for inflation and changing household sizes over this time (ABS, 2022b).

The jobs market has been strong in recent years, with high levels of employment growth and labour force participation and declining unemployment and underemployment rates. Indeed, almost all indicators in the employment domain of the Australian Cohesion Index have moved in a positive direction since 2008 (see the chapter ‘The Australian Cohesion Index’). Employment overall grew by 27 per cent between 2008 and 2022, substantially faster than population growth (ABS, 2023a). As a result, 80 per cent of Australians aged 15- 64 years were employed or looking for work in 2022, the highest level on record (going back to 1978) and a figure that increased from 77 per cent in 2008 (ABS, 2023b).

The strength of the jobs market is reflected in the unemployment rate. The unemployment rate increased from 4.2 per cent in June 2008 to 6.4 per cent in October 2014 and reached as high as 7.6 per cent during COVID-19 in July 2020 (ABS, 2023a). However, the unemployment rate dropped substantially over the next two years, reaching 3.6 per cent in June 2022 and remaining around that level since.

Underemployment has followed a similar trend, with the proportion of employed people who would like to be working more hours peaking at 14.6 per cent in April 2020 before declining to 6.3 per cent in June 2022 (ABS, 2023a).

*Using the ABS chain volume measure.

Economic inequality and poverty

Critical to social cohesion is the extent to which the gains from economic growth are shared equitably across society. This is evident on the Mapping Social Cohesion survey where concerns about economic fairness translate to a perceived weakening of social inclusion and justice in Australia. The Scanlon-Monash Index of Social Inclusion and Justice declined from a peak of 110 in 2009 to 88 in 2022. In 2022, 81 per cent of people agreed the gap between high and low incomes is too large and 59 per cent of people disagreed that people living on low incomes receive enough financial support. The majority of people (68 per cent) still believe that Australia is a land of economic opportunity where hard work brings a better life. However, this proportion has declined by approximately 11 percentage points over the last ten years.

Concerns about social inclusion and justice come after a period of increasing economic inequality in Australia since the 1970s. According to the World Inequality Database (2023), the share of total pre-tax national income going to the top 10 per cent of income earners in Australia increased from a low of 24 per cent in the late 1970s to a high of 35 per cent in 2010. Encouragingly, income inequality appears to have stabilised since. The most commonly used measure of inequality, the Gini coefficient declined from 0.336 in 2007-08 to 0.324 in 2019-20 when measured on income flows (ABS, 2022b). A decline in the Gini coefficient indicates a decline in inequality. In more concrete terms, households in the top 20 per cent of income earners earned 40 per cent of all disposable income in 2019-20 after controlling for different household sizes, a similar share to 2007-08 (41 per cent).

Relative poverty is strongly related to income inequality and appears to have experienced a similar trajectory. The most common measure of relative poverty is the proportion of individuals or households whose combined household income is less than 50 per cent of Australia’s median income. According to data compiled in the OECD’s (2023b) Income Distribution Database, the extent of relative poverty increased from 11 per cent in 1995 to almost 15 per cent in 2008. It appears as though this figure has since declined, shifting from 14 per cent in 2012 to 13 per cent in 2020. This is a reasonably high level of poverty compared with other high-income countries, below the likes of Japan, Spain, South Korea and the United States but higher than Canada, the Netherlands, Ireland, Belgium and the Nordic countries (OECD, 2023b).

Wealth inequality has worsened somewhat. The Gini coefficient measured on household net worth increased from 0.565 in 2007-08 to 0.605 in 2019-20 after adjusting for changing household sizes (ABS, 2022b). Across the period from 2009-10 to 2019-20, the wealthiest 20 per cent of households in Australia held approximately 62 per cent of total wealth in Australia, with 38 per cent held by the remaining 80 per cent of households.

Education

The equity and performance of education systems in Australia are critical to addressing wider economic disadvantage and inequality. Of concern though, indicators of educational performance on the Australian Cohesion Index have been at best stable over time and, at worst, declining. The national average NAPLAN scores for Year 9 reading and numeracy have moved up and down by small amounts in recent years and are at similar levels in 2022 to what they were in 2008 (ACARA, 2023). Potentially of some concern though, almost 9 per cent of Year 9 students were assessed as being below national minimum standards for reading, a figure that was closer to 6 per cent in 2008 and across the 2008-2019 period.

Declining educational results have been reported on the Programme for International Student Assessment (PISA). The most recently reported edition of PISA in 2018 assessed the reading, maths and science skills of more than 14,000 Australian students aged 15 years, as part of an international assessment across 79 countries (ACER, 2019). In 2018, PISA scores in Australia were significantly below 23 countries for maths, 10 countries for reading and 12 countries for science. Between 2006 and 2018, average scores among Australian students declined by 10 points for reading, 29 points for maths and 24 points for science.

Financial hardship

Absolute financial deprivation and hardship is an important barometer of social and economic functioning and our individual and collective material wellbeing. This can be measured through indicators of housing and financial stress. Housing stress is common among low-income earners and particularly renters. The most common measure of housing stress is the 30/40 rule. This says that households are facing housing stress if they are paying more than 30 per cent of their income in rent or mortgage payments and they are in the bottom 40 per cent of income earners. By this definition, 42 per cent of lower income households living in rented housing were living in housing stress in 2019-20, an increase from 35 per cent in 2007-08 (ABS, 2022c). We do not yet know how many households have experienced housing stress since 2019-20. We do know though that rents have increased sharply across the eight capital cities since the end of 2021 (ABS, 2023c).

The experience of housing and financial stress translates to a diversity of sacrifices and hardships. Approximately, one-in-five households indicated they would be unable to raise $2,000 in a week for something important in 2019-20, equating to approximately 1.9 million households (ABS 2022a). More than 900,000 households or approximately one-in-ten could not pay electricity, gas or telephone bills on time or went without dental treatment in the last 12 months. Between 3 and 4 per cent of households went without meals or could not pay their rent or mortgage on time. Overall, 35 per cent of households reported experiencing some form of financial hardship in 2019-20, with 9 per cent of households reporting four or more types of hardship.

So most of the Centrelink payment, you know, goes to pay rent on my house and [there is] just a little bit of money left for me. So I only can buy something I really need, you know? To be honest, there is not much money for food…

Sometimes, for example, if I want to buy a cup of tea, you know, on the weekend, before I am thinking about that, I have to think about my money, so if I bought this cup of tea maybe next time I don’t have money for something. (Interview 6.4).

Financial difficulties appear to have become more common in recent years. According to results from the General Social Survey, the proportion of households unable to raise $2,000 in a week increased from 15 per cent in 2006 to 20 per cent in 2019 and 19 per cent in 2020, while the proportion with a cash flow problem in the last 12 months increased from 19 per cent in 2006 to 22 per cent in 2019 and 21 per cent in 2020 (ABS, 2021).

Government economic supports provided during the COVID-19 pandemic appear to have protected households from financial stress. On the Mapping Social Cohesion survey, the proportion of people who were satisfied or very satisfied with their financial situation increased significantly during COVID-19 from 64 per cent in 2019 to 73 per cent in 2020. However, as economic supports during the pandemic were withdrawn and cost of living pressures started to bite, the proportion satisfied declined to 64 per cent in 2022 and the proportion dissatisfied with their finances increased from 27 per cent in 2020 to 35 per cent in 2022.

I feel people are really, really struggling big time. Even like my husband and I, we’re on a pretty decent income, and even now I feel like for the first time ever it’s pay-check to pay-check with the mortgage and groceries (Interview 3.1).

The cost-of-living continues to be a major issue facing Australians. According to the Taking the Pulse of the Nation survey, 29 per cent of women and 25 per cent faced financial stress in July 2023, up from 22 per cent and 17 per cent a year ago (Melbourne Institute, 2023). Financial stress appears to have increased across demographic and socioeconomic groups and is particularly common among single parent families, lower educated, lower income and unemployed Australians.

For cultural communities there are added elements to the impact of increasing living costs. Many families are not only supporting themselves financially but loved ones overseas. As costs increase in Australia there are added complexities to decisions about how money is used and prioritised that impacts not only the Australian household but extended family overseas.

The wage is not enough, especially if you come from different country, you don’t live for yourself, you live for your family back home as well. Everyone is supporting this family, sending back money home to maybe refugees who they left behind. All these things make their life harder here because the money they get is shared between their family and them. The people are struggling, I think (Interview 1.16).

I have my parents, so I’m supporting them. Every 3 months I send some money to them. Not too much, but just to survive. But now I can’t send that much. Over there, it is also very hard. My brother hasn’t asked me for help before. But now they also need my help as well (Interview 1.14).

Price increases have also particularly been felt around the cost of traditional food items, clothing and religious items (often brought in from overseas) that form an important part of daily life and cultural expression for many Australians.

I think where cost of living affects a lot of ethnic communities is in the purchase of traditional kinds of goods when it comes to food and stuff. Like buying papaya or a custard apple or something like mangosteen, even green banana, jackfruit, and stuff that people are used to with their cultures. That’s where things get pretty expensive. Because they are not regular goods that you get here. It’s not like you go to Coles and they’re stocking some jackfruit up there. I think the cost of living for communities in trying to buy the goods that are associated with their culture, particularly when it comes to food or clothing, traditional spices, that can be quite expensive (Interview 4.2).

Broader impacts of financial hardship

Financial hardship is not just an economic issue but has wider implications for the health and wellbeing of many Australians and for their connection to and participation in Australia’s social fabric. Along with age, financial position is the most important predictor of a person’s perceived sense of social cohesion in Australia (O’Donnell, 2022). People who describe themselves as poor or struggling to pay the bills are 29 per cent less likely to have a great sense of belonging in Australia than people who are prosperous or living very comfortably, 16 per cent less likely to feel they belong in their neighbourhood, 45 per cent less likely to trust the Federal Government all or most of the time and 40 per cent less likely to believe that most people generally can be trusted. People who are struggling financially are also 32 per cent more likely to report being unhappy in the last 12 months.

Financial wellbeing is likely to have an important bearing on the strength and harmony of multiculturalism in Australia. Reported attitudes to immigrants and multiculturalism have become more positive in recent years – and across all demographic and socioeconomic groups (O’Donnell, 2022). However, financial and cost-of-living pressures are an emerging threat. People who say they are struggling financially are less likely to believe that multiculturalism has been good for Australia and more likely to see immigrants as a social, cultural and economic problem. In 2022, 30 per cent of Australian-born adults who described themselves as poor or struggling to pay the bills agreed that immigrants take away jobs, compared with 14 per cent of those living very comfortably or prosperously.

Financial and cost-of-living pressures also impact migrant Australians themselves, including their material, personal and social wellbeing. Experiences are diverse, but among the people we interviewed, many say their households are facing food insecurity, making tough choices between meeting household expenses and eating regular meals.

The constantly increasing cost of living has forced many people to have to choose between paying bills or buying food. There is no right or easy choice there… If it were not for the help from organizations like Foodbank, Oz Harvest, and many church charities, many of these people would starve. It is a sad indictment that this situation should occur in Australia – the supposed ‘Lucky Country’ (Interview 4.4, written response).

Other households are making ends meet by either cutting down on the quantity of food they consume or by reducing the consumption of expensive but nutritional elements like meat.

You know the food is expensive, too. Before I can give my family two meals with meat every week and then one day is curry day. But now I have cut down to only one meat dish. Now I say, ‘I have to do that. Sorry. I’m so sorry to restrict you guys’ (Interview 1.14).

With growing demands on household finances, families are cutting back luxuries.

I think one point is that we miss things. No one is going for a holiday <laugh>, no one goes to the cinema or something. So we just sit at home, go to work, come back, and then pay bills and then everything. That’s a challenge (Interview 1.17).

There is less money for socialising and less time, as families look for additional work or take on additional hours to meet their living expenses.

Before we have social gatherings. Every week or every second week, we met each other. But now we understand the hosts are also facing a lot of financial difficulty. So instead of gathering once a week like before, now we maybe meet once a month or not even once a month (Interview 1.14).

This is having an impact on community connection, as well as relationships within families.

Kids have been bumped around to be looked after because the parents have to go to work. [They] have to be looked after while taking extra work. So kids just move from here to here to there so you can get someone to look after them so they can go to work. That means that people are not looking after themselves. Community social events, people don’t have them… So the social fabric, how it operates, help giving, go visiting someone and connecting is disappearing. So that’s one of the biggest challenges… It’s the fabric of the way we live, which is the important part for social and mental wellbeing (Interview 3.7).

Economic pressures and inequalities are multidimensional issues, affecting not just our material wellbeing but also our collective wellbeing and social cohesion. Hardship and inequality can create social division and the potential for polarisation while also contributing to less happiness and weaker personal wellbeing. Encouragingly, the economy continues to grow and the labour market has been particularly strong in the last couple of years, pointing to potentially positive times ahead if the recent increase in the cost of living proves to be temporary. Slow growing incomes, mixed educational outcomes and steady increases in financial stress and wealth inequality across the 2010s, however, suggest challenges in the years ahead in ensuring sustainable, equitable and inclusive development.

Expert Commentary by Professor Guay Lim

Written by Guay Lim
Professorial Fellow, Melbourne Institute: Applied Economics and Social Research,
The University of Melbourne

‘The data presented here prompted me to think about what economic policies we should consider delivering long-term socio-economic outcomes that will improve the lives of all Australians. What positive actions can we take to promote inclusive, sustainable economic growth?’

It is pleasing to see a report that presents the multi-dimensional factors affecting social cohesion in Australia and how economic and material wellbeing fits within that context. Fundamentally, it highlights the complex challenges facing governments in terms of developing sensible and supportive policies that will deliver tangible socio-economic returns across a range of dimensions for all Australians.

Over the past few years our economic and material wellbeing have been adversely affected by the COVID-19 pandemic and, recently, by high-inflation and increased costs of living. In the Melbourne Institute, we run a survey to understand consumer expectations and one of the questions asked of respondents is whether their family finances are better-off or worseoff compared to one year ago, and also whether they expect it will or will not improve one year from now. Overwhelmingly, people’s perceptions about their current financial position and future prospects have been very bleak for a few years and we see this pessimistic outlook reflected in parts of this report.

The data presented here prompted me to think about what economic policies we should consider to delivering long-term socio-economic outcomes that will improve the lives of all Australians. What positive actions can we take to promote inclusive, sustainable economic growth? And by that we mean increasing the standard of living, creating productive employment opportunities and ensuring that the benefits from economic growth are distributed more evenly throughout Australian society.

Viewing economic policy through this lens raises the importance of investing in Australia’s human capital. In 2020, the World Bank’s Human Capital project gave Australia a score of 0.77 on a scale between 0 and 1. What this score indicates is that the future earning potential of children born today will be 77% of what they can expect to achieve with full health (defined as no stunting and survival up to at least age 60) and achieving full formal education potential (defined as 14 years of high-quality school by age 18). Can policy do more to improve early childhood learning and care?

Alongside this, it is also worth noting, that an increasing proportion of the Australian workforce is in service-based sectors with more and more jobs in the health and aged-care sectors (reflecting the increasing percentage of older Australians in the population). Furthermore, the rate of female participation in the workforce has been increasing compared to a relatively steady rate of male labour force participation and this needs to be factored into policy discussions about productive employment. Again, can policy do more to support an ageing population as well as improving the education and training sector to meet current and future skill needs?

In short, as Australia recovers to a new normal, it would be useful to bear in mind the trends in the labour market, and to think strategically about policies to promote better health, education and employment outcomes. Shaping the recovery to achieve inclusive and sustainable economic growth outcomes will promote more positive economic and material wellbeing with favourable impacts on social cohesion.

Introduction

Life expectancy

General health

The burden of disease

Mental health and wellbeing

Health and social cohesion

Inequalities in health and wellbeing

Expert Commentary by Dr Kunhutu

Introduction

Physical and mental health is central to our personal and collective wellbeing. Good health reflects elements of both the quantity and quality of life. Life expectancy is the most widely used indicator of the quantity or length of life and has been trending in a positive direction in Australia over many decades, even notwithstanding the devastating impacts of COVID-19 in other parts of the world. In terms of quality of life, this is matched by a reasonably high level of self-assessed health and wellbeing and a decline in some health risk factors including smoking and risky alcohol consumption. However, health inequalities exist on all domains of health, particularly for First Nations Australians and those from socioeconomically disadvantaged backgrounds.

Social cohesion is important for our collective health and wellbeing. Research shows that aspects of our social connections, resources and networks are related to our physical and mental health (Ehsan et al., 2019). Social cohesion especially within neighbourhoods and local communities provides a positive social environment from which people derive a sense of identity, belonging and connection, strong friendship and personal support networks and a sense of confidence and safety in engaging with others. Research shows that these types of social resources protect people from common mental disorders including depression and anxiety (Ehsan & De Silva, 2015). Neighbourhood cohesion was particularly important during COVID-19 lockdowns in Australia, helping to ease stresses and symptoms of depression and loneliness (O’Donnell et al., 2022).

In this chapter, we explore trends in the quantity and quality of life in Australia from a health perspective. The discussion relates particularly to the health and worth domains of the Australian Cohesion Index (see the chapter ‘Australian Cohesion Index’). We describe trends in life expectancy, general and mental health and personal wellbeing. We point to some of the important health inequalities across Australia and explain how these relate to our collective wellbeing and social cohesion.

Life expectancy

Australia has one of the longest life expectancies in the world. According to the most recent life tables published by the ABS (2022d), Australian females can expect to live 85.4 years on average from birth while males can expect to live 81.4 years. Males and females combined can expect to live 84.3 years on average, the third highest level in the world (ABS, 2022d).

As has been the case in all corners or the world, life expectancy in Australia has increased dramatically over the last century and more. In the period 1881-1890, male and female life expectancy was just 47.2 years and 50.9 years respectively (ABS, 2014). Advances in medical technologies and our understanding of health and wellbeing saw rapid progress over the next 100 years. By the 2006-2008 period, male and female life expectancy had reached 79.2 and 83.7 years respectively. Progress has been slower since, perhaps as we reach (much debated) biological limits to human lifespan. Nevertheless, male and female expectancy steadily increased by 2.1 years for males and 1.7 years for females between 2006-2008 and 2019-2021 (ABS, 2022c).

The COVID-19 pandemic resulted in a substantial loss of life around the world and the erasing of many years of progress in raising life expectancy (Schöley et al., 2022). But not in Australia. Indeed, Australia was one of a few countries in which life expectancy increased during the heights of the COVID-19 pandemic in 2020 and 2021 (Canudas-Romo et al., 2022). While life expectancy declined by 2.4 years in the United States between 2019 and 2021 (Xu et al., 2022) – a decline unprecedented in the last 100 years – life expectancy in Australia increased by 0.4 years for males and females (ABS, 2022c).

Despite considerable success in extending life expectancy, inequalities remain. Most critical is the gap between First Nations Australians and the rest of the population. Estimating First Nations’ life expectancy is a difficult and complex task, not least for the different ways in which Indigeneity is recorded over time in Censuses and death records (O’Donnell & Raymer, 2015). According to estimates from the ABS (2018), Indigenous females can expect to live 75.6 years, while males can expect to live 71.6 years on average, based on data for the period 2015-2017. This suggests that Indigenous males and females live 8.6 and 7.8 years shorter than non-Indigenous Australians.

Data and research suggest First Nations’ life expectancies have been increasing and the gap to non-Indigenous Australians is closing (AIHW, 2023a; Zhao et al., 2022). Between 2005- 2007 and 2015-2017, the gap in life expectancy between Indigenous and non-Indigenous Australians declined from 11.5 to 8.6 years for males and from 9.7 to 7.8 years for females (AIHW, 2023a). While this represents welcome improvement, the decline is well short of the national target under the Closing the Gap strategy (Productivity Commission, 2023).

Inequalities in life expectancy exist on other social and economic grounds. Recent research suggests there is a 9.1 year gap in life expectancy between male adults with University qualifications and those who do not complete high school (Welsh et al., 2021). Death rates have also been shown to be higher and life expectancy lower in regional and remote Australia and in neighbourhoods with high socioeconomic disadvantage (AIHW, 2023a; Raymer & O’Donnell, 2021). Up to the end of April 2022, overseas born Australians were 2.5 times more likely to die of COVID-19 than the Australian-born population after accounting for their age structures (AIHW, 2022a). COVID-19 death rates were particularly high among people born in north Africa and the Middle East, southern and eastern Europe and the Pacific Islands.

General health

The length of life is, of course, just one component of our overall health and wellbeing. This was strongly driven home during the COVID-19 pandemic where the protections on our lives came at some cost to our freedom of movement and our social, mental and economic wellbeing (O’Donnell et al., 2022; 2023; O’Donnell, 2023).

Health-adjusted life expectancy is an important metric for understanding the extent to which we are living in good health. This metric divides total life expectancy between the number of years we can expect to live in full health and the number of years lived in ill health. According to estimates from the Australian Burden of Disease Study 2022, healthy life expectancy increased from 72.8 years in 2003 to 74.1 years in 2022 for females and from 69.4 years to 71.6 years for males over the same period (AIHW, 2022b). This level of increase (1.3 years for females and 2.2 years for males) is less than the overall increase in life expectancy during this period, suggesting that while we are living in good health for longer, we are living in ill health for longer too.

Australians nevertheless generally have a positive view of their overall health. Amidst the COVID-19 pandemic, 86 per cent of adults assessed their health as excellent, very good or good on the 2020-21 National Health Survey (ABS, 2022e) – similar to where it has been since the 2007-08 survey (85 per cent).

The burden of disease

The cause and burden of poor health comes from a variety of health conditions. In the 2021 Census, more than 7 million Australians were reported to have a long-term health condition, 30 per cent of the responding population (ABS, 2022f). The most commonly reported conditions were mental health conditions (2.2 million people), Arthritis (2.1 million), Asthma (2.1 million), Diabetes (1.2 million), heart disease (1.0 million), cancer (732,000) and lung conditions (441,000).

The total burden of disease measured in terms of deaths and poor health is greatest for cancers, musculoskeletal, cardiovascular, mental health/substance use and neurological conditions (AIHW, 2022b). According to the Australian Burden of Disease 2022 study, coronary heart disease has the single largest burden on the population, though its burden has fallen substantially over the last 20 years (AIHW, 2022b). The burden of other leading diseases including stroke, lung cancer, rheumatoid arthritis and bowel cancer also declined over this time. Dementia, by contrast, increased substantially, along with chronic obstructive pulmonary disease and osteoarthritis. The incidence of some cancers including breast cancer and melanoma also appear to be increasing, even after adjusting for the effects of population ageing (AIHW, 2023b)

Several risk factors contribute to overall health. Smoking, weight and alcohol consumption are three key factors that are tracked in the Australian Cohesion Index (see the chapter ‘The Australian Cohesion Index’. Data to track these trends come from the ABS (2022f) National Health Survey. While the trends have been somewhat mixed overall, we continue to make progress in key areas. Smoking continues to become less common over time. The proportion of adults who smoke on a daily basis declined from 19 per cent in 2007-08 to 11 per cent in 2020-21. Risky levels of alcohol consumption also appear to have become less common over time. In 2020-21, 15 per cent of adults exceeded lifetime risk guidelines in their alcohol consumption, down from 21 per cent in 2007-08 (ABS, 2022e). On the downside, the proportion of adults classified as overweight or obese according to their measured Body Mass Index (BMI) increased from 61 per cent in 2007-08 to 67 per cent in 2017-18 (ABS, 2022e).

Mental health and wellbeing

Mental health and wellbeing is a particularly important issue in Australian society and one with implications for social cohesion and collective wellbeing. In the Australian Burden of Disease study, anxiety had the fifth highest burden of all diseases in Australia in 2022, depressive disorders were in ninth place and suicide and self-inflicted injuries were in sixth place (AIHW, 2022b). While the measured burden of anxiety and depression are similar to what they were in 2003, the burden of suicide and self-inflicted injuries has increased.

The Australian Cohesion Index tracks the extent of psychological distress. In 2020-21, 15 per cent of adults were estimated to be experiencing high or very high levels of psychological distress (ABS, 2021). This is a higher proportion than was recorded in 2017-18 (13 per cent) and 2007-08 (12 per cent). Elevated levels of distress in the 2020-21 period are likely associated with COVID-19. Australian research shows that levels of psychological distress increased during the pandemic in early 2020 and, while levels fluctuated over the course of 2020 and 2021, remained above pre-pandemic levels in early 2022 (Biddle & Gray, 2022).

The strain of the pandemic and lockdown restrictions on personal and social wellbeing and connections was reflected in several of interviews with people who have migrated to Australia. Some of the impact of social connections may have lasting impact.

I kind of lost a lot of very close connections [from] before the pandemic with a lot of Spanish speaking families. Some of them had to relocate to other areas, which makes it even harder to meet with them. We used to keep in touch with each other by WhatsApp… And I think now everyone’s got to a point of saturation of messages or separation using communication by a technology. That’s been a while now. We used to celebrate things like birthdays and things like that… but that completely stopped. So we haven’t really been able to do that. We realize that we don’t have the time. We don’t have the energy or we don’t have the funds to do that sort of things anymore (Interview 1.3).

I feel sad because I haven’t visited [my home country] for six years. Because of COVID and my girls, they have exams. I can’t take them from school and can’t take a break. And I need to work (Interview 6.5).

The general wellbeing of the Australian population is showing signs of strain irrespective of the impacts of COVID-19. The Scanlon-Monash Index of Worth (which incorporates social, emotional and financial wellbeing) declined from a score of 100 in 2007 to 90 in 2018 (O’Donnell, 2022). While scores increased in 2020 during the pandemic, they have since declined to pre-pandemic levels. On the 2022 survey, 78 per cent of adults said they had been happy or very happy over the last year. While this proportion has been reasonably stable since 2019, the survey detected a modest decline in happiness between 2015 and 2019 (O’Donnell, 2022). In 2022, 49 per cent of adults said they felt isolated from others some of the time (40 per cent) or often (9 per cent), while 39 per cent felt that things they had done in the last 30 days were worthwhile only some or a little of the time (O’Donnell, 2022).

Australians have mixed feelings about their future. In 2022, only 9 per cent of adults believed their life in Australia would be much improved in the next three or four years, 35 per cent thought it would be a little improved, 33 per cent thought it would be the same as now and 22 per cent thought it would be a little or much worse (O’Donnell, 2022). Older Australians and people who are struggling financially were the most likely to believe their life would be worse in three or four years.

I can call it [the cost of living] painful, really, because it has put us under a lot of pressure. Today I was talking with my friends. You really can’t maintain a stable life because it’s getting [harder] day after day. It’s not just like a one-time increase. It’s like every three months there is a new increase and new costs or new expenses. Because if you bought something like, for example, kitchen appliances or house equipment, they are not going to last for long. So if you have any equipment damaged or that needs to be replaced, you cannot buy it at the same price, or even close. And if you have kids, that will be doubled, depending on how many kids you have. For me as a single mom, it’s really very hard to make me happy and my girls happy and for us to live in a stable life condition. It [the financial circumstances] is very stressful (Interview 6.5).

Health and social cohesion

Personal wellbeing is closely connected to social cohesion. As was shown in the 2022 Mapping Social Cohesion report, people who are unhappy, feel isolated from others, feel they are not treated with respect or feel that the things they do in life are not worthwhile report a substantially lower sense of belonging in Australia and in their communities, a weaker sense of social inclusion and justice including trust in the Federal Government and less acceptance of people from different backgrounds (O’Donnell, 2022).

Psychological distress is also strongly connected to social cohesion. People with the highest levels of psychological distress* in the 2022 Mapping Social Cohesion were almost one-half as likely to say they have a great sense of belonging in Australia as people with no symptoms of distress, half as likely to say they trust the Federal Government to do the right thing by the Australian people all or most of the time and 38 per cent less likely to believe that, generally speaking, most people can be trusted.

It is difficult to determine the extent to which social cohesion directly influences mental health and wellbeing, and vice versa. The connections between cohesion, health and wellbeing could be because i) cohesion contributes to good health, ii) good health contributes to greater community engagement and a heightened sense of cohesion and/or iii) good health and perceived cohesion both derive from other personal and social factors. While an active area of research, a growing number of studies suggest that social resources, connections, networks and cohesion are important part of the social environment that supports and protects health and wellbeing (Ehsan et al., 2019; O’Donnell et al., 2022).

2 Defined as scores of 19 or more on the Kessler-6 scale.

Inequalities in health and wellbeing

Inequalities in health and wellbeing across Australia are, in turn, a potential source of strain on social cohesion. Health inequalities adversely impact disadvantaged, First Nations and regional communities. People living in the most socioeconomically disadvantaged 20 per cent of neighbourhoods are between 1.3 and 1.5 times more likely to have a lung condition, kidney disease, diabetes or a mental health condition than the total national population after accounting for age differences in the population (ABS 2022f). First Nations Australians are between 1.7 and 2.6 times more likely to have kidney disease, a lung condition, diabetes, dementia, asthma, heart disease or a mental health condition, while people living in regional Australia are 1.2 times more likely to have a lung or mental health condition, asthma or arthritis. Overseas born Australians, by contrast, are generally less likely to have a long-term health condition (ABS, 2022f).

Happiness and personal wellbeing vary substantially by age, household composition, voting preference and socioeconomic factors. On the 2022 Mapping Social Cohesion survey, 88 per cent of people aged 65 years and over said they were happy or very happy, compared with approximately 75 per cent of people aged 18-54 years and 78 per cent of the total adult population. Meanwhile just 71 per cent of people who live alone, 72 per cent of Greens party voters and 41 per cent of people who describe themselves as poor or struggling to pay bills say they have been happy or very happy over the last 12 months. Groups who were most likely to say they feel isolated from others often or some of the time include people who are struggling financially (76 per cent), 18-24 year-olds (67 per cent), renters (62 per cent) and single parents (62 per cent).

Australians live long and healthy lives on average. Life expectancy has continued to increase, even though COVID-19 and we continue to have positive perceptions of our own health. Substantial progress has been made in reducing the burden of several diseases, including heart disease and lung cancer, along with the prevalence of some of their risk factors including smoking and risky alcohol consumption. However, several diseases including cancers have become more prevalent and burdensome while health inequalities continue to disproportionately First Nations Australians and people from disadvantaged backgrounds. Mental health and wellbeing remains a persistent issue across Australia. Social wellbeing and cohesion is particularly important for its relationship to mental health and wellbeing, providing the social environment, resources and support that protects our wellbeing through daily life and in times of crises.

Expert Commentary by Dr Kudzai Kunhutu

Written by Dr Kanhutu 
Infectious Diseases Specialist and Principal Fellow, School of Population and Public Health,
The University of Melbourne

‘Unfortunately, there is a lack of culturally inclusive supports, particularly across the age spectrum, for people seeking mental health care in this country. People from diverse backgrounds have justifiable concerns about being able to have safe conversations without being othered or disrespected.’

This report reflects much of what I have observed in practice, particularly the alignment between socio-economic advantage or disadvantage and an individual’s feelings of personal wellbeing and belonging in Australia.

Social cohesion involves people feeling that their needs are being considered, understood, and met. It is about feeling valued enough to want to express your opinion and to know that you will be heard. This applies as much to accessing healthcare services as it does to every other facet of our lives.

It was surprising to see the high number of people who reported having spoken to a Member of Parliament, and who are feeling disgruntled with the state of our democracy. Factors such as these naturally impact individual health and wellbeing because they influence people’s trust in ‘the system’ and how they feel about themselves and their place in Australian society. When the governments we elect fail to deliver the healthcare outcomes promised in their policy commitments, this affects people’s trust in our national institutions, our leaders and the democratic process. It also means people are not able to benefit from the new or expanded services that were promised. There is no point pumping money into the healthcare system if it makes little or no difference to the end users’ experience.

This ties in with everything that’s coming through in this report around the importance of nurturing welcoming and supportive neighbourhoods where people feel like they belong. Health initiatives at the local government level are more likely to be positively received, implemented and felt. It is also easier to monitor results at the local level to see whether they are reaching the right people and having the desired impact. We also need to recognise that failing to engage with potentially vulnerable communities during times of relative stability leads to missed opportunities in prevention and adds layers of complexity to any future disaster. This is what we saw playing out during COVID. If the only times people hear from public health authorities are during times of crisis, it sends the message that this is purely a transactional relationship. That generates cynicism, distrust and a greater likelihood that people will continue to disengage from services and care.

It is not surprising that the marker for adults experiencing psychological distress is high at the moment. This mirrors what is happening globally. Unfortunately, there is a lack of culturally inclusive supports, particularly across the age spectrum, for people seeking mental healthcare in this country. People from diverse backgrounds have justifiable concerns about being able to have safe conversations without being othered or disrespected.

Another emerging trend is the move towards a more digitised health system. While telehealth served us well during the pandemic, we are now seeing some services only offering remote consultations. People who have already had negative experiences with bricks and mortar health services are unlikely to trust them in a virtual format. Digital services are proving to be even less culturally responsive and not particularly nuanced in responding to different peoples’ needs. This leaves people feeling even more disenfranchised.

Experiencing discriminatory biases while engaging with healthcare services further limits an individual’s sense of choice. Health practitioners are often unaware of their discriminatory blind spots until someone calls them out. When a patient experiences ignorant or illconsidered comments and micro-aggressions that leave them feeling denigrated, they are less likely to return to that healthcare provider and more likely to feel reluctant about engaging with other services. We need to create safe opportunities for people to share their stories of experiencing discrimination or bias within the healthcare system. By identifying what is happening that is not acceptable, we can promote more respectful and responsive healthcare practices.

It comes down to how well we are engaging with different groups of people, how we organise ourselves as a society around difference, and how we treat difference respectfully. Currently, the default position appears to be one of problematising difference.

Introduction

Domain 1: Material conditions – income and wealth

Domain 2: Material conditions – employment

Domain 3: Health

Domain 4: Education

Domain 5: Participation and connections

Domain 6: Political action

Domain 7: Belonging

Domain 8: Worth

Domain 9: Social inclusion and justice

Domain 10: Acceptance and rejection

Introduction

In this chapter, we present the quantitative data to inform the Australian Cohesion Index. This component provides an important barometer of how social cohesion and broader social, economic and personal wellbeing have been faring in Australia over the last 15 years.

Data are sourced from multiple sources and organised into ten domains. The first five domains relate to material conditions, like income and economic inequality, employment, health, education and social, community and civic participation. The second five domains are drawn from the Scanlon Foundation Research Institute’s Mapping Social Cohesion study. The five domains match exactly those used in the Mapping Social Cohesion study to track social cohesion in Australia since 2007. Together, these ten domains provide a comprehensive assessment of the state of our collective wellbeing and cohesion in Australia, delving deeply into both the attitudes and perceptions of Australians and their material conditions and resources.

The datasets used to inform the Australian Cohesion Index have been conducted at various time points and across various intervals. As far as possible, we have tried to align datasets to give us a consistent picture of how social cohesion and wellbeing have been tracking over the last 15 years. Some of our key datasets are based on surveys that have not been conducted or results published in the last couple of years. This includes the ABS Survey of Income and Housing, the National Health Survey and the General Social Survey. In all cases, we use the latest available data.

In comparing results to previous years, we start with ‘base’ year estimates from around 2007. Base year estimates can be for anywhere between 2006 and 2010 depending on when surveys were conducted and data are available. Some estimates represent those for a calendar year (e.g. 2008), others for financial years (e.g. 2007-08) and others represent estimates averaged over multiple years (e.g. 2007-2009).

We calculate an estimate of ‘progress’ for each indicator in the Australian Cohesion Index. Progress is measured by calculating the percentage change in scores between the base year and the latest year. Progress is indicated by an increase in scores for many indicators like household income and a decline in scores for other indicators like rental stress. In other words, an increase in household income is ‘good’, while an increase in rental stress is ‘bad’. For indicators where an increase in scores is ‘good’, we calculate the percentage change directly. For indicators where an increase is ‘bad’, we first transform the scores by dividing values of 100 by the raw scores – and then calculate the percentage change.

The trajectories of each indicator are tracked over time by calculating change over time as an index. Each index starts from a value of 100 in the base year. Index values are calculated in subsequent years by dividing the indicator score in that year by the indicator score in the base year and multiplying by 100. For example, the index score for GDP person in 2022 is calculated by taking GDP per person in 2022 ($83,678), dividing by GDP per person in 2007 ($73,674) and multiplying it by 100. As above, we transform indicators where an increase in scores is ‘bad’ first before calculating the index scores. In this way, an increase in index scores in the charts on the following pages always indicate positive progress.

The five domains of social cohesion extracted from the Mapping Social Cohesion study each contain an overall index of progress. These are calculated with the Scanlon Monash Index of Social Cohesion (see O’Donnell, 2022). Given the near intractable difficulties, we have not sought to calculate a single overall index score across the other domains.

The Mapping Social Cohesion survey underwent a major transformation and modernisation process in 2018-2019, shifting from a telephone survey to a largely online survey administered to the Social Research Centre’s Life in Australia tm. In the tables in this chapter, we show progress on both the telephone surveys (2007 to 2018-19) and Life in Australia tm (2018-19 to 2022). Because of the different ways people respond to the telephone versus the online survey, the results of the Mapping Social Cohesion survey are not directly comparable before and after 2018-19.

We derive a total estimate of progress over the 2007-2022 period that adjusts for the transition to Life in Australia tm. In 2018 and 2019, the Mapping Social Cohesion survey was run as both a telephone survey and on Life in Australia tm. This overlap allows us to calculate the effect of the transition to Life in Australia tm for each indicator. We calculate this by dividing average indicator scores in 2018 and 2019 on Life in Australia tm by the average 2018-19 scores on the telephone surveys. Progress is then estimated by calculating the change in indicator scores between 2007 and 2022 and dividing by the estimated transition effect. This allows us to estimate progress over the entire 2007-2022 period, adjusting for the transition to Life in Australia tm.

It is important to recognise that these are aggregate-level estimates for all of Australia. While they are important and valuable for tracking trends at a national level, the attitudes, experiences and outcomes of individuals and groups will vary widely across the country. Progress on any indicator does not therefore indicate progress for all Australians or necessarily progress in tackling social inequalities.

Domain 1: Material conditions – income and wealth

Domain 2: Material conditions – employment

Domain 3: Health

Domain 4: Education

Domain 5: Participation and connections

Domain 6: Political action


Domain 7: Belonging

Domain 8: Worth

Domain 9: Social inclusion and justice

Domain 10: Acceptance and rejection

Qualitative Methodology

Table A1 Interviewees by state

Table A2 Interviewees by country of origin (regional groupings)

Table A3 Length of time in Australia

Qualitative Methodology

Qualitative interviews were conducted during July and August 2023 to supplement the statistical data provided by the subjective and objective indicators of the Australian Cohesion Index. Qualitative interviews provide a rich source of data about the lived experience of individuals within Australian communities and can assist us to understand the dynamics of social cohesion at the local level. Social cohesion is indeed a multi-dimensional construct, comprised of many indicators, including the levels of trust people have in one another and in government and other institutions, the degree to which people help one another and feel they belong and to extent to which they are engaged in their communities and political systems.

This study aimed to examine how overseas-born culturally diverse Australians develop a sense of community and national belonging and identity; to identify the factors that enable and hinder these processes and to examine the extent to which belonging contributes to overall social cohesion in Australia. In addition, it aimed to understand the impact of current challenges including (but not limited to) the cost of living, and to explore perceptions of government and individuals’ trust in institutions.

In total 53 interviews were conducted, covering the states of Victoria, New South Wales, Queensland, South Australia, Tasmania and Western Australia (see Table A1).

Table A1 Interviewees by state

State Interviewees
VIC 19
NSW 9
QLD 13
SA 5
WA 4
TAS 3
Total 53
Interviewees came from a range of different cultural backgrounds, which are summarised below according to region.

Table A2 Interviewees by country of origin (regional groupings)

Background Interviewees
Africa 16
Americas 4
East Asia 19
South Asia 7
Middle East 2
Europe 5
Total 53
The largest cohort came from East Asia, which encompassed the countries of Afghanistan, Hong Kong, China, Malaysia, Cambodia, Indonesia, Myanmar and Japan. Several individuals also came from South Asia (India, Sri Lanka and Bangladesh). Six interviews with individuals from Chinese cultural background were conducted in Mandarin with a bi-lingual interviewer. Individuals in the African regional group came from Central Africa (Central African Republic), Southern Africa (South Africa), Northern Africa (Sudan) East Africa (Burundi, Ethiopia, Tanzania) and West Africa (Ghana, Nigeria). Middle Eastern interviewees came from Kurdish and Iraqi backgrounds; those from the Americas came from Colombia and Honduras. The European interviewees were predominantly from Bosnia, the Czech Republic, Italy and Armenia. Individuals came from different gender backgrounds (31 female, 23 male) and had been in Australia different lengths of time (see Table A3).

Table A3 Length of time in Australia

Length of time in Australia Interviewees
< 5 years 13
5 – 10 years 9
> 10 years 30
Unknown 1
Total 53
Recruitment occurred through the networks of the Scanlon Foundation Research Institute, using a snowballing technique. Organisations, including community organisations, settlement organisations, service providers, migrant peak bodies and migrant resource centres were contacted by phone or email and invited to share information about the study via their networks. Individuals who expressed interest in participating were provided with an information sheet that gave further details of the study. All interviews were conducted voluntarily and individuals received a $50 Woolworths voucher after the interview to thank them for their time. Each interview took approximately 30 to 45 minutes. Interviews were conducted by Zoom and recorded and a de-identified transcript was used as a basis for the qualitative analysis, ensuring individual anonymity via a code system where each person was allocated an individual interview number. No individual chose to discontinue the interview or to withdraw part or all of the information they provided to the study. Interviews were semi-structured (loosely structured around a set of pre-determined questions). The interviews sought to gain insights into some of the substantive areas of the Index. Questions addressed life in the community, including current challenges; individuals’ sense of belonging to Australia (at a community and national level); perceptions of government and views about democracy; perceptions of the cost of living and experiences of discrimination.

Background

Acknowledgements

Contact Us

Background

The Australia Cohesion Index 2023 is a critical barometer of the health, wellbeing and connectedness of Australian society. Drawing on quantitative and qualitative data from multiple sources, the Australian Cohesion Index provides comprehensive information to track our national progress on multiple personal, social and societal domains.

The 2023 report is the second edition of the Australian Cohesion Index, after its inaugural launch as part of the Mapping Social Cohesion 2021 study (Markus, 2021). In the 2023 report, we build on the findings of the inaugural edition with new data and research covering the period from approximately 2008 to 2022. We use the same ten domains as were used in 2021, covering a diverse range of topics from income and wealth to education, health, participation and the sense of belonging, worth and social inclusion and justice.

This report is designed to present the results in each domain of the Australian Cohesion Index and perhaps more importantly, elaborate on the intersections and connections between domains. In particular, we draw on quantitative and qualitative data as well as some of the national and international research in this field to explain how our attitudes and perceptions of social cohesion in Australia are connected to substantive outcomes, behaviours and experiences in health, education, employment, community engagement and the economy. These analyses provide important pillars in bridging our understanding between social cohesion and overall collective wellbeing.

You can read the full report here.

Acknowledgements

The Australian Cohesion Index 2023 was made possible through the support and vision of the Scanlon Foundation in its ongoing support of research into social cohesion in Australia. Special thanks to Peter Scanlon, Chair of the Scanlon Foundation.

The Institute is grateful to the Department of Home Affairs for their support in the production and publication of the Australian Cohesion Index.

Special thanks to the Australian Bureau of Statistics for providing additional data, which was vital to creating this in-depth picture of Australia today.

The contributions of the teams at the Social Research Centre, including Andrew Ward, Benjamin Phillips, Wendy Heywood, and Alison Eglentals, are sincerely appreciated.

Further, the Institute is most appreciative for the support of the Australian National University in supporting James O’Donnell’s resources and capacity to author this publication.

The Scanlon Foundation Research Institute extends its appreciation to the individuals and organisations who have contributed to the completion of this report.

The Institute takes immense pride in its Research Team – James O’Donnell, Trish Prentice, Rouven Link, Qing Guan – whose hard work ensured the successful compilation of this report.

Our heartfelt thanks to Peter Mares, Danielle Wood, Kate Reynolds, Guay Lim and Kudzai Kanhutu for their expert commentary.

Finally, the Institute acknowledges the collective efforts of all those who participated in interviews and discussions, providing us with information and experiences that were crucial in shaping our findings.

Contact Us

To find out more information about the Australian Cohesion Index please contact Celia Tran via info@scanloninstitute.org.au or +61 (03) 8614 3435.

Interested in diving deeper
into this report?

Share this page

Media enquiries:    Sally Tyrell   |  sally@blackbirdpr.com.au   |   0431 206 523